Chapter 4 How to import your data
In this book several datasets are used targeting different research questions. However, a fair part of the analysis tools are common. That is, descriptive analysis, plots, response correlations etc.
The data is included in the R-packgage devtools you get by running the code below. Be aware that you need devtools package to install from github, so you need to run both code lines.
# install data-package
install.packages('devtools')
devtools::install_github('mortenarendt/data4consumerscience')
The data is also available as excel sheets, and can be loaded using packages capable of reading from Excel. Below is an example using data from the so-called iBuffet.
4.1 iBuffet data - Read in data from Excel
The data from the iBuffet comes in the form of csv or Excel files.
Lad os se om skidtet virker… - take 2
These can be in the form of
- Consumption data from the Buffet
- Survey data on liking, motivation, choices etc linked to the particular buffet data
- Survey data on demographics for the participants such as age, gender, eating habits etc. These are general and different from the former, in that they have nothing to do with the current buffet.
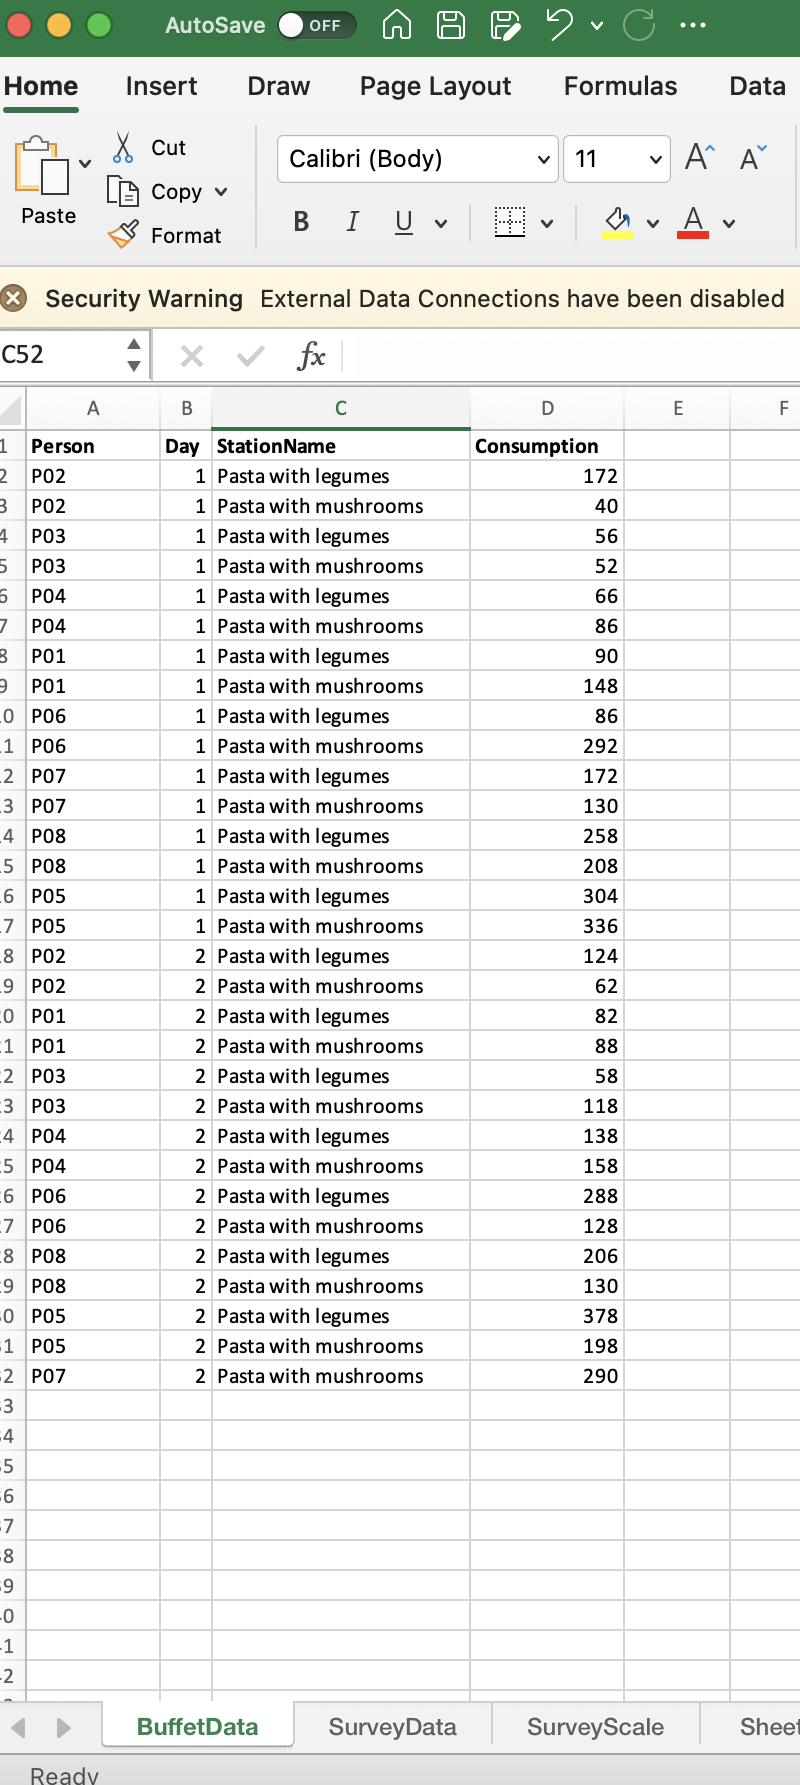
[Måske en ide at TILFØJE noget a la dette: In the dataset you should have one line per buffet station per participant per experimental day. In the example below: P07 have chosen both from the Pasta with legumes and the Pasta with mushrooms buffet on Day 1, whereas P07 have only chosen from the Pasta with mushrooms buffet on Day 2. The consumption is in gram. See example below.]

Example of Buffet data
4.1.1 Example of Survey data
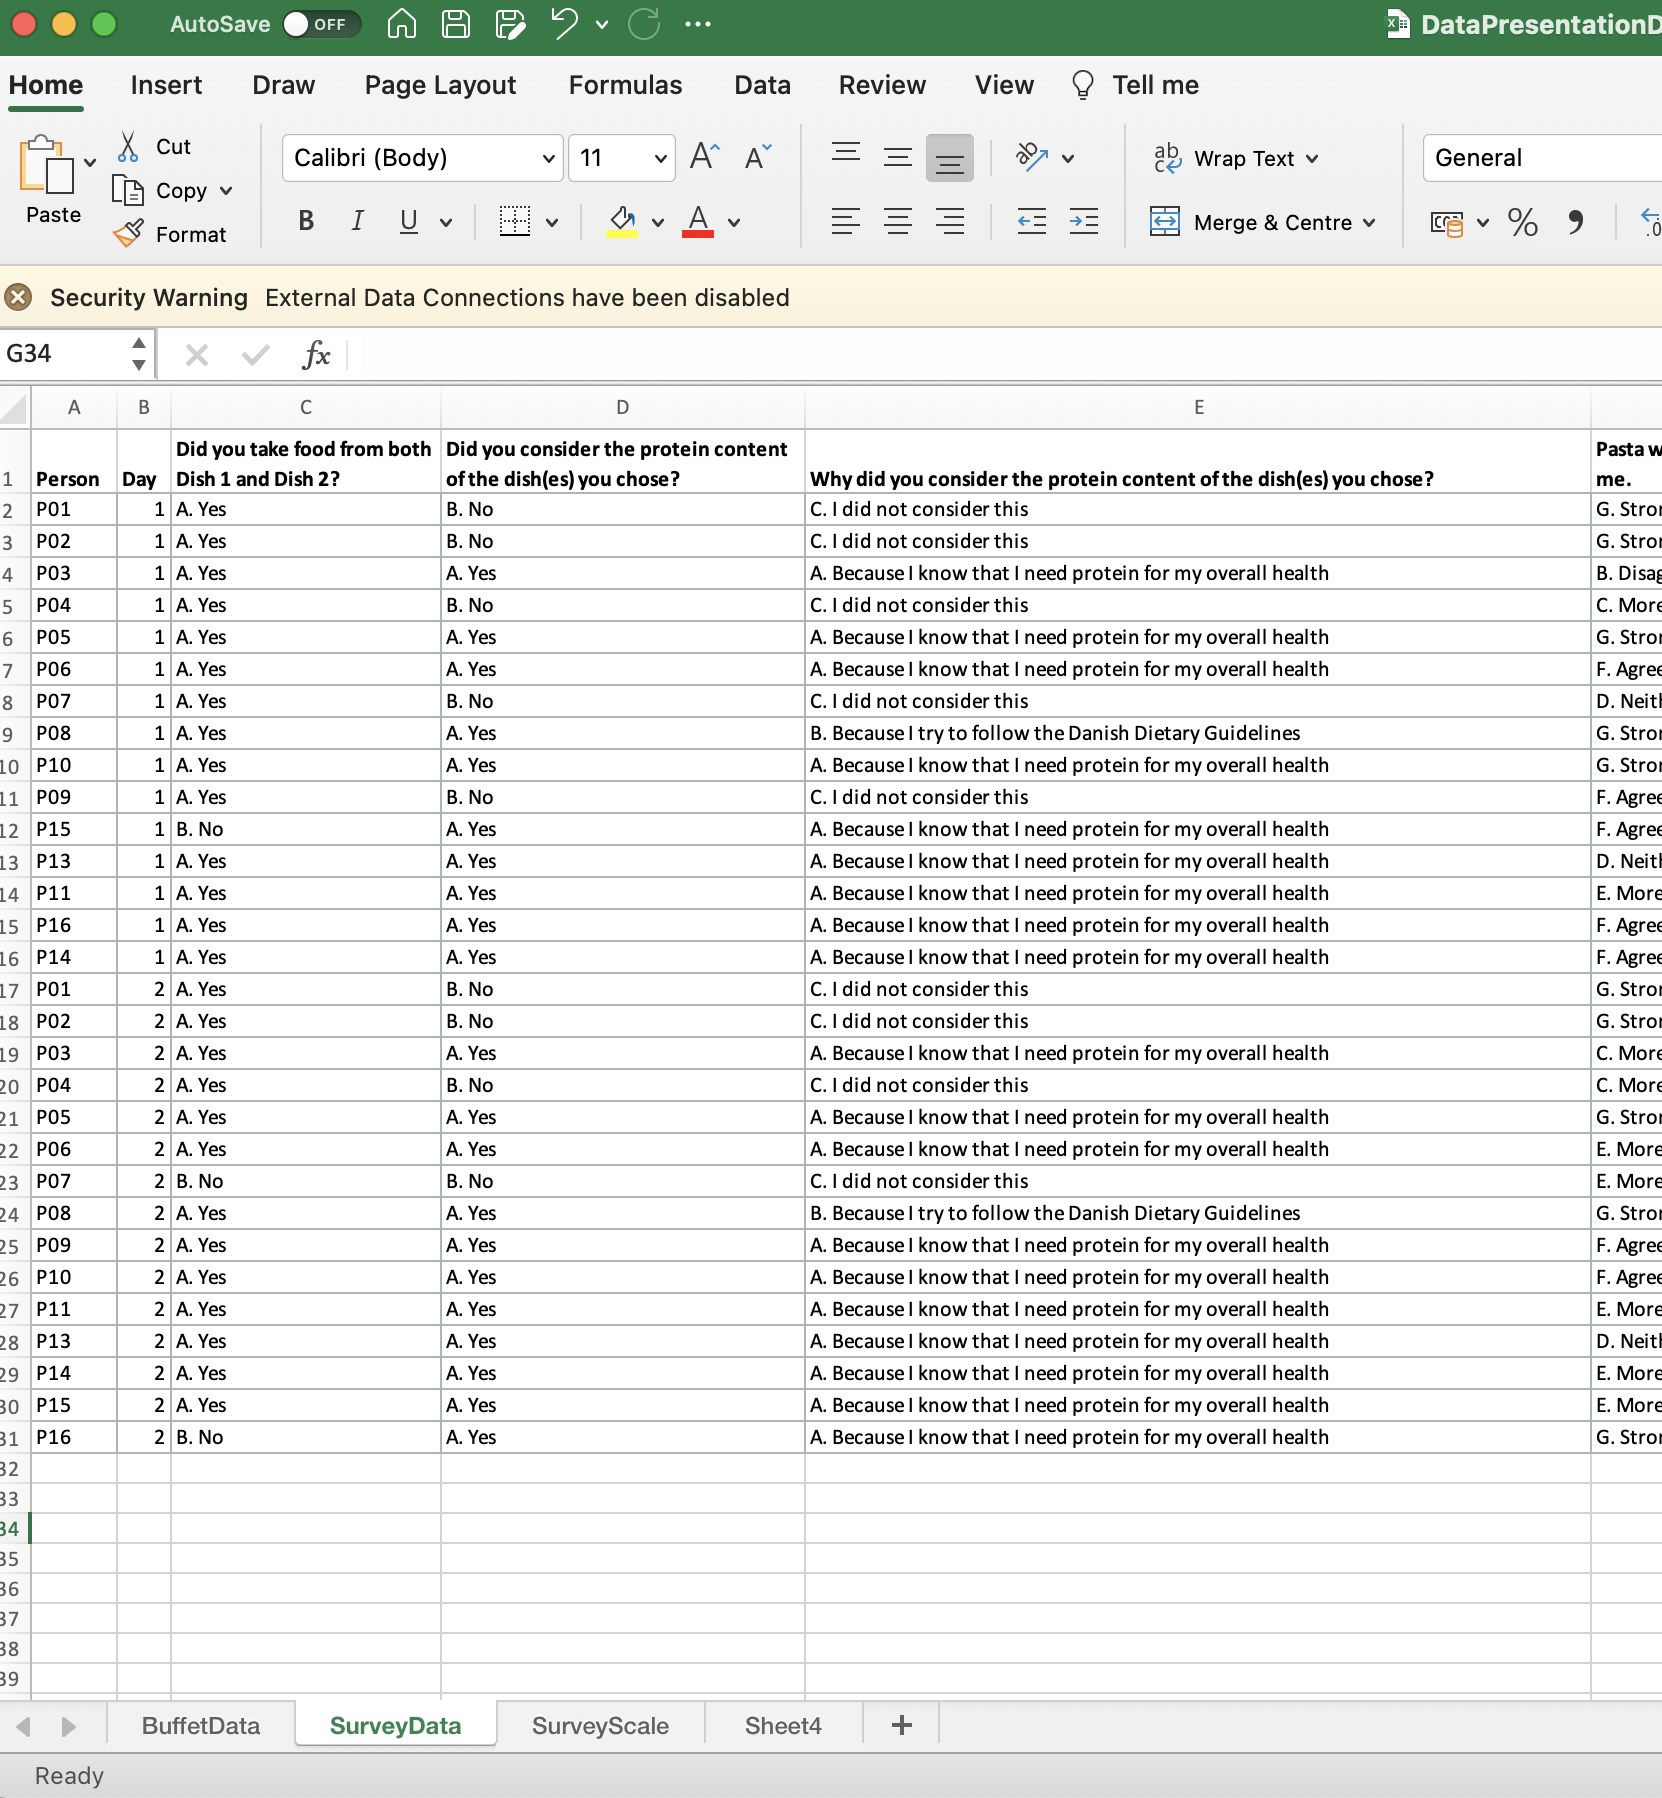
[TILFØJ: In the dataset you should have one line per participant per day. If the survey is not related to the buffet data (assessment of either samples or meals) you only need to have one line per participant. In the example below: P01 has answered questions in coloumn C and on both days.]

Example of Survey data
[RETTELSE AF SCREEN SHOTS: Excel skal zoomes mere ind, da det er ulæseligt. Måske endda også cutte “toppen” af på 2.1 Read in data from Excel - iBuffet, så det kun er selve Excel arket der ses?]
4.1.2 Example of Survey Scale
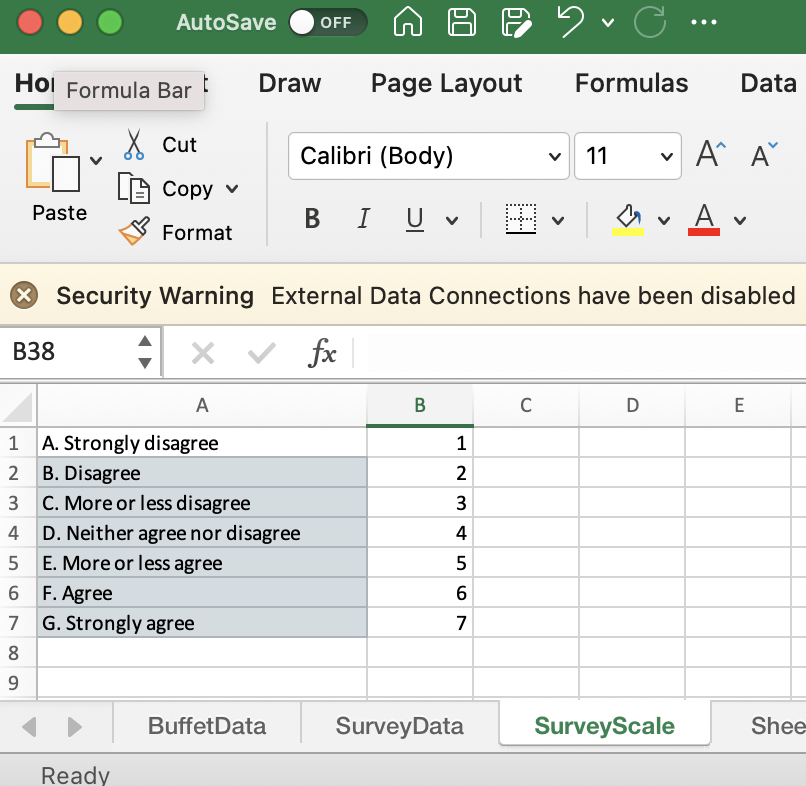
[TILFØJ: When you have statements as answers in your survey, you might need to translate these in to numbers. In the example below, you can see which statement corresponds to which number, if the scale is conveterted to a numerical scale SLET: toppen af Excel arket, så det er mere læseligt]

Survey Scale used
4.1.3 Edit your dataset in Excel
Turn the individual files (Buffet data and survey data) into sheets in Excel collecting all your data in one file.
Setup the data in Excel such that they match the above in terms of format.
What is important is:
- First row is used on headings and none of these are repeated. I.e. all unique within a sheet
- Data comes from row 2
- All rows should contain data (empty cell as also data, e.g. an unanswered question), so all empty rows are removed
- Headings between sheets referring to the same: e.g. participant ID should have exactly similar heading.
- If you have calculated stuff within Excel such as a sum of the numbers in a column, then these should be removed from the sheet. It is not data!
We suggest that you keep both the original version of the data as a sheet, and the ready-to-import version as a sheet, so you do not accidentially delete data.
4.1.4 Importing to R
Each of the Excel sheets are imported separately. Here we use the package readxl with the function read_excel. If the data is not in the same folder as your script, then include the path to the data, or move the data to the script’s location. Be aware that the SurveyScale sheet (see above) does not have a heading. Here we import without (col_names = F), and set it manually afterwards, but you can also put it in manually in Excel beforehand.
[MORTEN: Skal der stå noget om hvordan de gemmer et script?? når du selv skriver noget med at gemme ovenfor. vi kan risikere de ikke ved noget om det… Eller skal vi beholde min intro som indtalt, hvor de kommer igennem import, faktorer osv.?]
library(readxl)
Buffet <- read_excel('./data/iBuffet.xlsx',sheet = 'BuffetData')
Survey <- read_excel('./data/iBuffet.xlsx',sheet = 'SurveyData')
Surveyscales <- read_excel('./data/iBuffet.xlsx',
                           sheet = 'SurveyScale', col_names =  F)
colnames(Surveyscales) <- c('answ','number')
[TILFØJ: Her kunne det være en ide med enten en mp3 hvor koden gennemgåes eller en mp4 hvor skærmen optages med koden på samtidig med, der tegnes på skærmen rundt om delene og forklares. Jeg har sendt dig et forslag]
Have a look at the imported elements to ensure that indeed, they mimic the Excel-sheets. head(), str() and View() is your tools.
head(Buffet)## # A tibble: 6 × 4
## Person Day StationName Consumption
## <chr> <dbl> <chr> <dbl>
## 1 P01 1 Pasta with legumes 90
## 2 P01 1 Pasta with mushroom 148
## 3 P02 1 Pasta with legumes 172
## 4 P02 1 Pasta with mushroom 40
## 5 P03 1 Pasta with legumes 56
## 6 P03 1 Pasta with mushroom 52str(Buffet)## tibble [60 × 4] (S3: tbl_df/tbl/data.frame)
## $ Person : chr [1:60] "P01" "P01" "P02" "P02" ...
## $ Day : num [1:60] 1 1 1 1 1 1 1 1 1 1 ...
## $ StationName: chr [1:60] "Pasta with legumes" "Pasta with mushroom" "Pasta with legumes" "Pasta with mushroom" ...
## $ Consumption: num [1:60] 90 148 172 40 56 52 66 86 304 336 ...[TILFØJ: speak eller film som beskrevet ovenfor] [TILFØJ: view() i kodeline ovenfor]
We see that the coloum with names (Person and StationName) is interpreted as characters (chr) while the stuff which should be numbers (Comsuption) is numeric (num). If that is not the case, you will need to transform them using as.numeric() or as.character().
[TILFØJ: Morten, kan du skrive script eksempel ind på dem?]
4.1.5 Editing in R
The Buffet data is optimal as is. We have the data as long format with all repsonses in one coloumn and then the next columns clarifying the design, time, type, person etc.
However the Survey data is not optimal directly. Things to fix: * For the last four questions, we to encode the the 7-point answers as a numerical factor, and have it correctly leveled. * The data can additionally be versioned in both long and wide format.
[RET: var det meningen ovensåtende skulle være som punktform?]
[For this we use the function Tidyverse … MORE INFO Morten] [TILFØJ: synes der skal være en speak til denne også.. Kan du hjælpe mig med den?]
library(tidyverse)
Surveylong <- Survey %>%
  gather(question,answ, `Pasta with legumes is visually appealing to me. `:
           `I like the taste of pasta with mushrooms! `) %>%
  mutate(answ = answ %>% factor(levels = Surveyscales$answ),
         answnum = answ %>% as.numeric())

Surveywide <- Surveylong %>% select(-answ) %>% spread(question,answnum)
4.1.6 Merging the data
For the sake of being able to compare consumption (obtained from buffet data) with liking and motives (obtained from the survey data) these data frames needs to be merged. There are several merge options, here we use left_join() but full_join() and right_join() might more suited in some situations.
[TILFØJ: If you feel more comfortable with Excel, you can also merge the two data frames in one Excel sheet before importing it]
[MORTEN: Du skal forklare forskelle på disse tre ellers kun bruge en, da det er forvirrende hvad forskellen er]
4.1.6.1 Adding survey to buffets
Merging should be done such that Person and Day in each separate sheet match. If you additionally have demographic data (gender, age, etc.) then obviously only Person should match, as the data is constant over Days.
[TILFØJ: Indtalt forklaring på koden?]
Buffet_survey <- Buffet %>%
  left_join(Surveywide, by = c('Person','Day'))
4.1.6.2 Adding buffet to survey
Similarly, merging should be done such that Person and Day match. If you additionally have demographic data (gender, age, etc.) then obviously only Person should match, as the data is constant over Days. Further, we use the long format of the survey data here.
Surveylong_buffet <- Surveylong %>%
  left_join(Buffet, by = c('Person','Day'))
Due to not having a total overlap of information, some responses (here for consumption) will be missing. That you can see using the table function.
table(is.na(Surveylong_buffet$Consumption))##
## FALSE
## 240[TILFØJ: Indtalt forklaring på koderne?]
4.1.7 Save the data
You can export any data frame from R to excel (for instance using the rio package), as well as saving it as .RData for further analysis.
Use save.image() to save everything, or use save() to specify which elements to save
save.image(file = 'iBuffetSurveyDataEverything.RData') # everything
save(file = 'iBuffetSurveyData.RData',
     list = c('Survey','Surveylong_buffet',
              'Surveylong','Buffet_survey','Surveyscales')) # just the usesul and non-redundant stuff.
rio::export(Surveylong_buffet,file = 'Surveylong_buffet.xlsx') # export one data frame
[TILFØJ: Indtalt forklaring på koderne?]
4.1.8 Ready for analysis
Once you have saved the data, you can simply load the data directly, and you do not need to do the import-setup every time you want to do an analysis on the data.
This part is not a part of the data import, but it is a good idea just to check that the data indeed is setup as expected.
load('iBuffetSurveyData.RData')